
XRP, Shiba Inu, Solana (SOL) and Ethereum (ETH) Price Analysis for June 10: Market Fuel Comes In Handy
Once again, XRP has encountered a wall of resistance in its most recent attempt at recovery. The asset briefly moved toward the declining trendline that has capped every rally since June after rising from the $1.02-$1.04 support zone. As was to be expected, sellers intervened close to the trendline and moving average intersection, pushing XRP back toward $1.09.
Technically, the picture is still conflicting. Positively, XRP is still printing higher lows than the June bottom, indicating that buyers are not giving up on the asset entirely. Bearish momentum is much weaker than it was a month ago, as the RSI has also recovered from oversold territory and is still above 40.
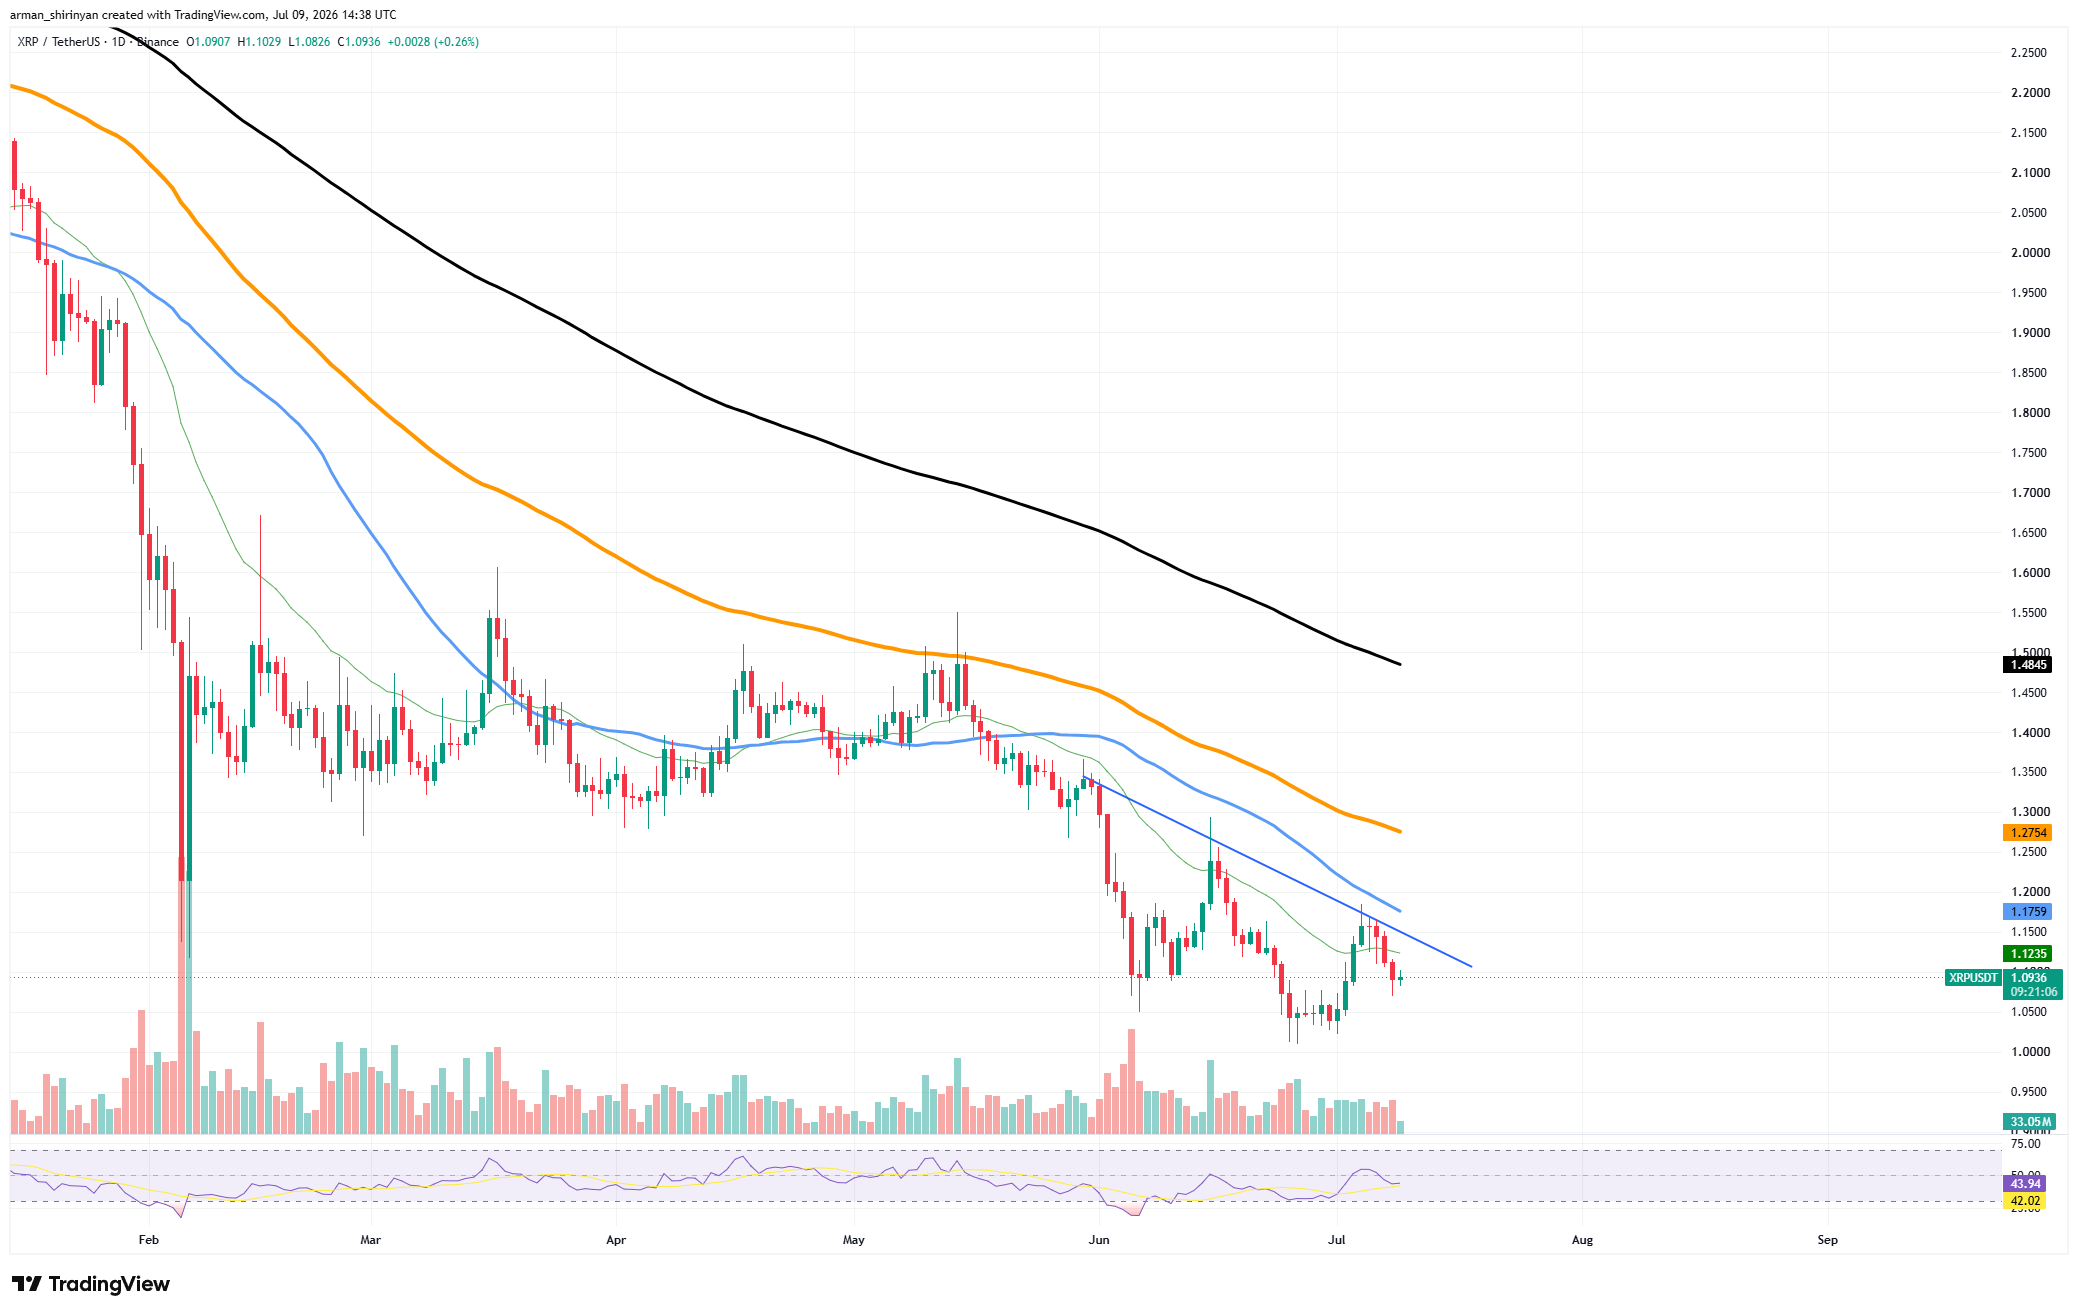
The issue is that XRP is still stuck below the 50-day EMA, which is around $1.12, and the 100-day EMA, which is around $1.17. Every rally is technically a relief bounce within a larger downtrend until those levels are regained. The descending resistance line is currently the most crucial level to monitor.
XRP, Shiba Inu, Solana (SOL) and Ethereum (ETH) Price Analysis for June 10: Market Fuel Comes In Handy
XRP Keeps Plunging Against Bitcoin
The short-term bearish structure would be invalidated by a breakout above it, opening the door to $1.17 and possibly $1.27, where the 200-day EMA is waiting. Another test of local lows is likely if XRP is unable to break through and loses support around $1.05. For the time being, XRP is engaged in a conflict between increasing momentum and stubborn overhead resistance.
Shiba Inu among weaker players
Among the most popular meme assets, Shiba Inu still has one of the weakest charts. The token recently made an attempt to rise above its June low, but the move was short-lived and resulted in yet another decline. After breaking down from several bullish formations over the previous few months, the chart shows SHIB trading around $0.0000043. Both the smaller recovery triangle that formed in June and the larger ascending channel that supported prices from March through May failed miserably.
You Might Also Like

At the moment, SHIB is still below all significant moving averages. The 100-day and 200-day moving averages are still much higher, but the 50-day EMA at $0.0000045 is serving as immediate resistance. The general trend is still bearish, as this alignment demonstrates. Weak momentum but not yet severe oversold conditions are indicated by the RSI’s mid-30s position. If sellers keep control, that allows for another decline.
The crucial support area is still between $0.0000041 and $0.0000042. Losing that area would probably result in a new yearly low and another leg lower. Reclaiming the 50-day EMA and holding above $0.0000045 is a much easier first step for bulls. Until then, SHIB is stuck in a long-term downward trend that is only broken by fleeting attempts at recovery.
Solana’s recovery potential
After one of its best attempts at recovery in weeks, Solana is nearing a critical technical turning point. SOL was able to recover both its 20-day and 50-day moving averages after the strong June rebound from the $60 area, and it briefly threatened the 100-day EMA near $81. At this point, the move has stalled.
The 100-day EMA, which continues to be the crucial resistance level averting a more significant trend reversal, is being rejected by the most recent candles. Even with the decline, the chart structure is still much better than it was a month ago. Throughout late June and early July, buyers were successful in defending higher lows, resulting in an ascending recovery structure.
You Might Also Like

Despite short-term weakness, momentum continues to favor bulls, as indicated by the RSI staying above 50. The recovery continues as long as SOL stays above the 50-day EMA at about $75. Another attempt at the psychologically significant $90 level, where stronger resistance from the spring consolidation is located, would probably be prompted by a fresh push above $81.
Instead of collapsing, Solana is currently consolidating following a significant advance. Whether this is another failed rally within the larger downtrend or just a pause before continuation will be determined over the next few sessions.
Ethereum gains fresh fuel
Compared to a large portion of the market, Ethereum is exhibiting surprising strength. ETH is currently testing a declining resistance trendline that has limited price action for weeks after rising back toward the $1,800 region after recovering from June lows close to $1,500.
According to the chart, ETH is positioned exactly between a rejection and a breakout. The RSI is still above neutral territory, suggesting that momentum is improving, and the price has recovered the 20-day and 50-day moving averages. Because of this, Ethereum is in a better position than many large-cap assets that are still stuck below important averages.
You Might Also Like

The descending trendline that is currently intersecting around $1,780-$1,800 is the most significant level. The recent bearish structure would be rendered invalid by a clear break above it, creating a path toward the 100-day EMA at $1,960. This would be Ethereum’s most significant bullish signal since the start of the overall market decline. Failure at resistance, though, might push ETH back toward the $1,700 support level.
However, buyers are arriving earlier and defending pullbacks more vigorously than in prior rallies. Ethereum is still among the market’s best prospects for a comeback, but before a more significant reversal can be announced, bulls must first confirm a breakout.